


Most brands segment customers with RFM: recency, frequency, monetary buckets. It is decades old, it is a reasonable first cut, and it is a blunt instrument.
It tells you someone bought recently and often, but not whether they are about to churn, whether they will only convert with a discount, or when they are likely to buy next. The more sophisticated tools produce propensity scores, but usually uncalibrated ones, which introduces a subtler and more dangerous problem.
How it is done today, and why it is weak
RFM is coarse and static: it sorts customers into a handful of boxes and cannot express likelihood at all. Uncalibrated propensity models are worse in a specific way, they can rank customers correctly while their raw scores mean nothing, so "0.9" and "0.6" tell you an order but not a probability.
The moment you start composing audiences with those numbers, treating a score as a real likelihood, the errors compound silently. And most tools will happily produce a confident score for a brand with almost no history, which is just noise wearing a decimal point.
Why we think this is worth getting right
We hold that autonomy must come with accountability: observable, controllable, attributable. A model that merely ranks is a black box you have to trust. A model whose outputs are calibrated probabilities is one you can reason about, combine with boolean logic, and audit.
Calibration is what turns a score into something both a human and a downstream system can trust, which is the precondition for everything else the platform does with customer-level predictions. Get this layer right and audiences, timing, and offers all inherit that trustworthiness; get it wrong and every decision built on top inherits the noise.
How LTV.ai approaches it
A suite of per-customer models predicts the things that drive marketing decisions. Each emits a per-customer score and a human-readable segment label.
| Model | Predicts | Segments |
|---|---|---|
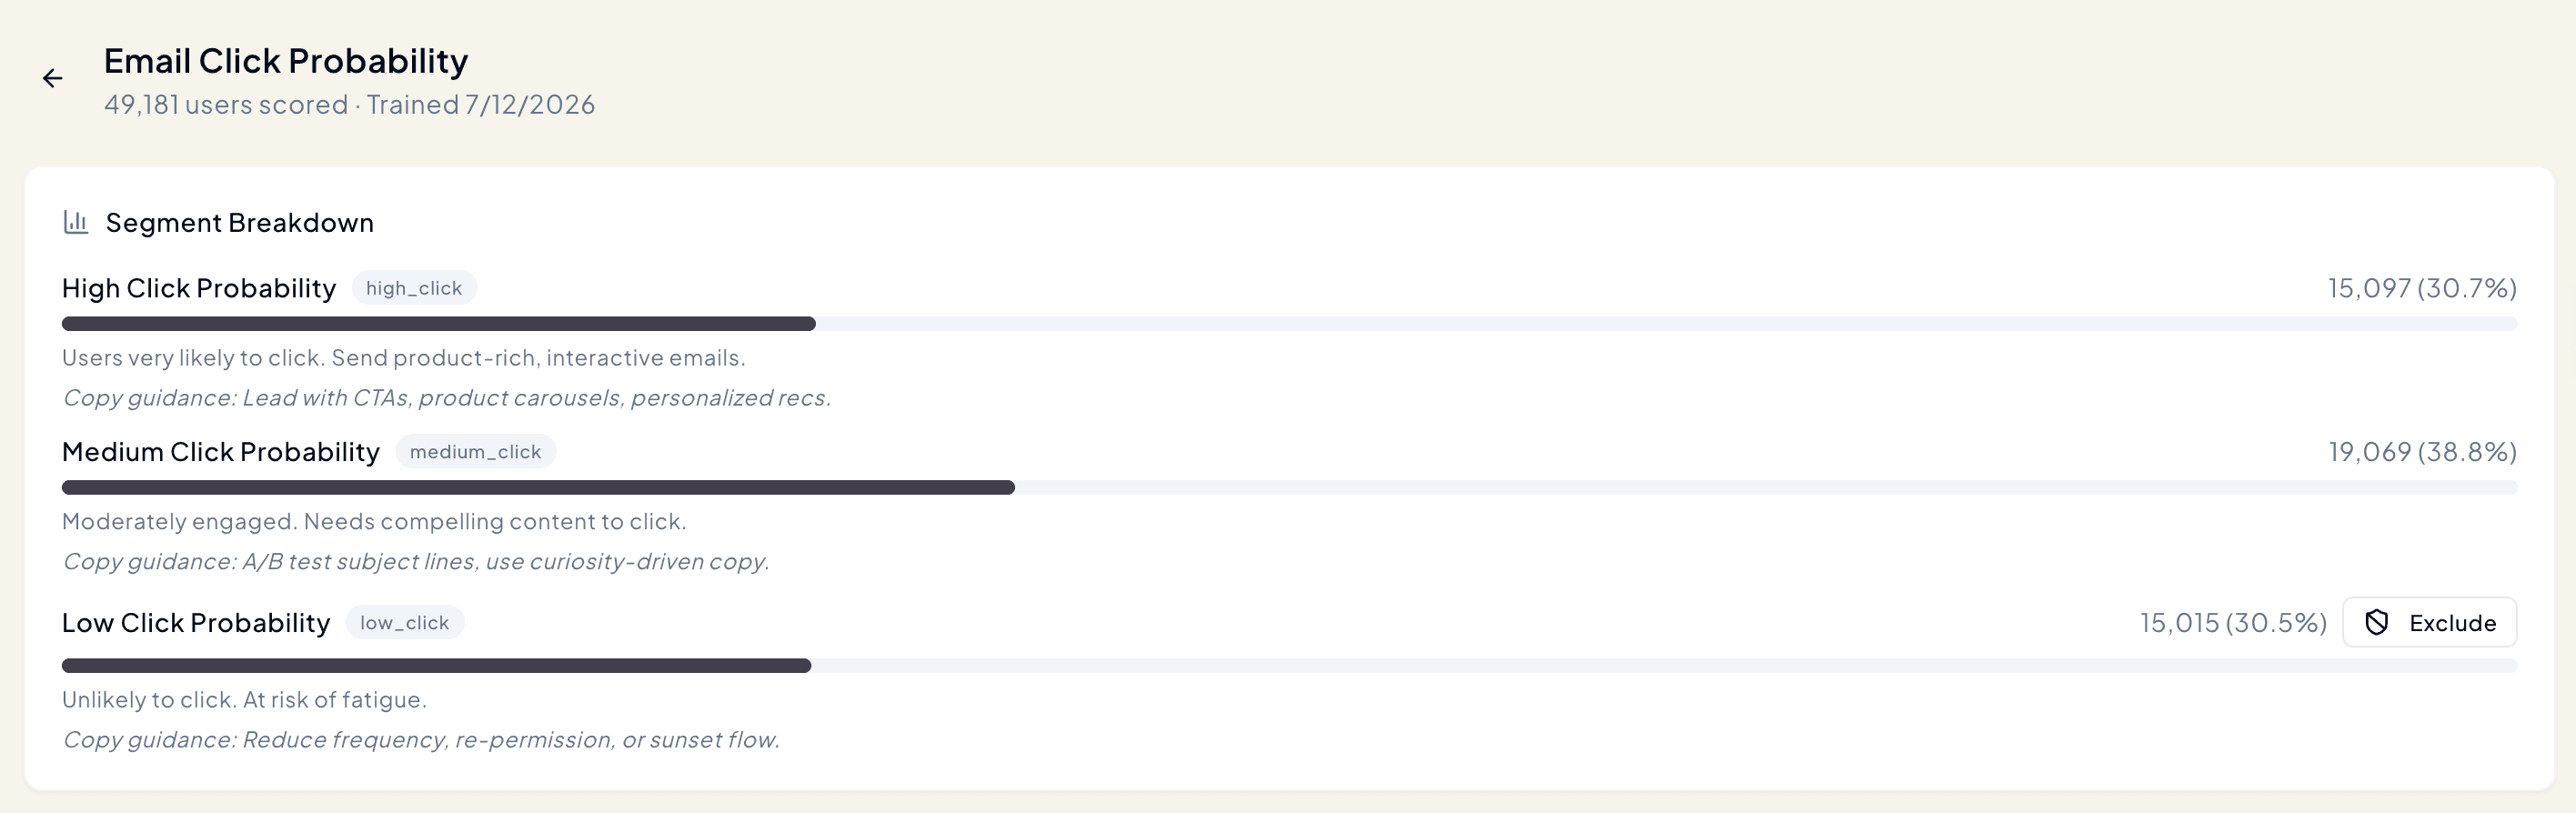
| Email Click Probability | click on the next email | high / medium / low click |
| Purchase Probability | purchase in the next 30 days | high / medium / low purchase intent |
| Churn Risk | disengagement | critical churn / at risk / safe |
| Customer Lifetime Value | 30-day expected revenue | VIP / high / mid / low value |
| Optimal Send Time | the hour of day each customer is most likely to engage | 24 hourly windows |
| Next Purchase Date | days to next order | imminent / soon / upcoming / distant |
| Engagement Score | composite 0 to 100 | champion / highly engaged / active / passive / dormant |
| Discount Sensitivity | needs a discount to convert | full-price buyer / occasional deal seeker / discount-driven |
| Follow-Up Propensity | click or buy if a follow-up is sent | high / medium / low, per customer and campaign |
The segment labels are the vocabulary marketers actually use when building audiences, which is why they matter as much as the predictions. Optimal Send Time is an hourly prediction rather than a coarse bucket, one of 24 windows per customer: see how LTV.ai predicts optimal send time.
Predictions are calibrated so the probabilities mean what they say, and models are validated out of sample so quality is measured, not assumed. On brands with too little history, a model reports insufficient data rather than training on noise, an honest refusal instead of a confident guess. The models use only first-party behavioral data, email and order history, not demographic or third-party data.
What the models actually see
Every model reads the same behavioral picture of a customer, built only from that customer's own email and order history, no demographic or third-party data.
Activity is windowed, the last 7 days, 8 to 30, and 31 to 90, so the models can tell a burst of recent interest apart from a long-ago habit. Events are exponentially time-decayed, so an open yesterday counts far more than one from three months ago, and scores track who a customer is now rather than who they used to be.
A 14-day acceleration trend captures momentum, whether someone is heating up or cooling off, and purchase-gap cadence captures rhythm, which is what makes next-purchase-date and replenishment timing possible.
On top of that, a lightweight per-brand model search picks the configuration that fits each brand's data best, validated out of fold, then calibrated so the probabilities mean what they say.
Follow-Up Propensity is scored per customer and per campaign, not once globally, because whether a follow-up is worth sending depends on the specific campaign. Models retrain automatically after each data sync, so scores track fresh behavior rather than going stale. And every model's status, its segment list, and a "users scored and last trained" summary are visible on a dashboard card, which is what makes the observable and controllable claim concrete rather than rhetorical.
How it stays honest and compounds
These calibrated scores and segments are the raw material for audience building, the inclusion and exclusion logic, and much of the decisioning layer; because they are probabilities, they can be combined in ways that actually mean something, which is what the audience shaping system relies on. Each customer's scores sharpen as their behavior accumulates, and the models improve as the brand's history grows and as cross-brand patterns refine the base.
Frequently asked questions
What data does it use? Each customer's own email and order history. No third-party or demographic data.
What happens on a small brand? The model reports insufficient data instead of producing an unreliable score.
Part of the machine learning behind LTV.ai.
See it on your store: book a demo.