


Ask most brands how they decide what to send this week and the honest answer is a mix of the promotional calendar and a hunch. The measurement, if any, comes afterward, as a dashboard reporting attributed revenue once the send is done. Decisions are made blind and graded in hindsight, which is exactly backwards for the highest-frequency spend decision a brand makes.
How it is done today, and why it is weak
There are two standard approaches and both are flawed. The first is intuition: send what feels right, find out later. The second, for the more sophisticated, is reporting attributed gross revenue after the fact.
The problem with attributed revenue is that it double-counts sales that would have happened anyway and ignores the discount cost used to get them. So the metric everyone optimizes toward quietly rewards discounting: run a deep enough promotion and the topline always looks great, even as the business earns less. Ranking ideas by that number steers a brand toward giving away margin to flatter a chart.
Why we think this is worth getting right
We win when our customers win, which means optimizing for what actually grows their business, margin, not the number that looks best in a report. If you can forecast the expected value of an idea before spending the send on it, you can prioritize the calendar by what will actually pay, avoid the low-value sends entirely, and stop the slow bleed of margin that topline-chasing causes. Prioritizing by expected margin, campaign after campaign, compounds into a materially healthier program.
How LTV.ai approaches it
Two predictive models work together. One estimates revenue per recipient, tuned for the reality that most recipients generate nothing and a few generate a lot, a heavily skewed, zero-inflated target that a naive regression handles badly. The other estimates click-through. Multiplied across the audience, they produce projected revenue, clicks, and, crucially, projected margin.
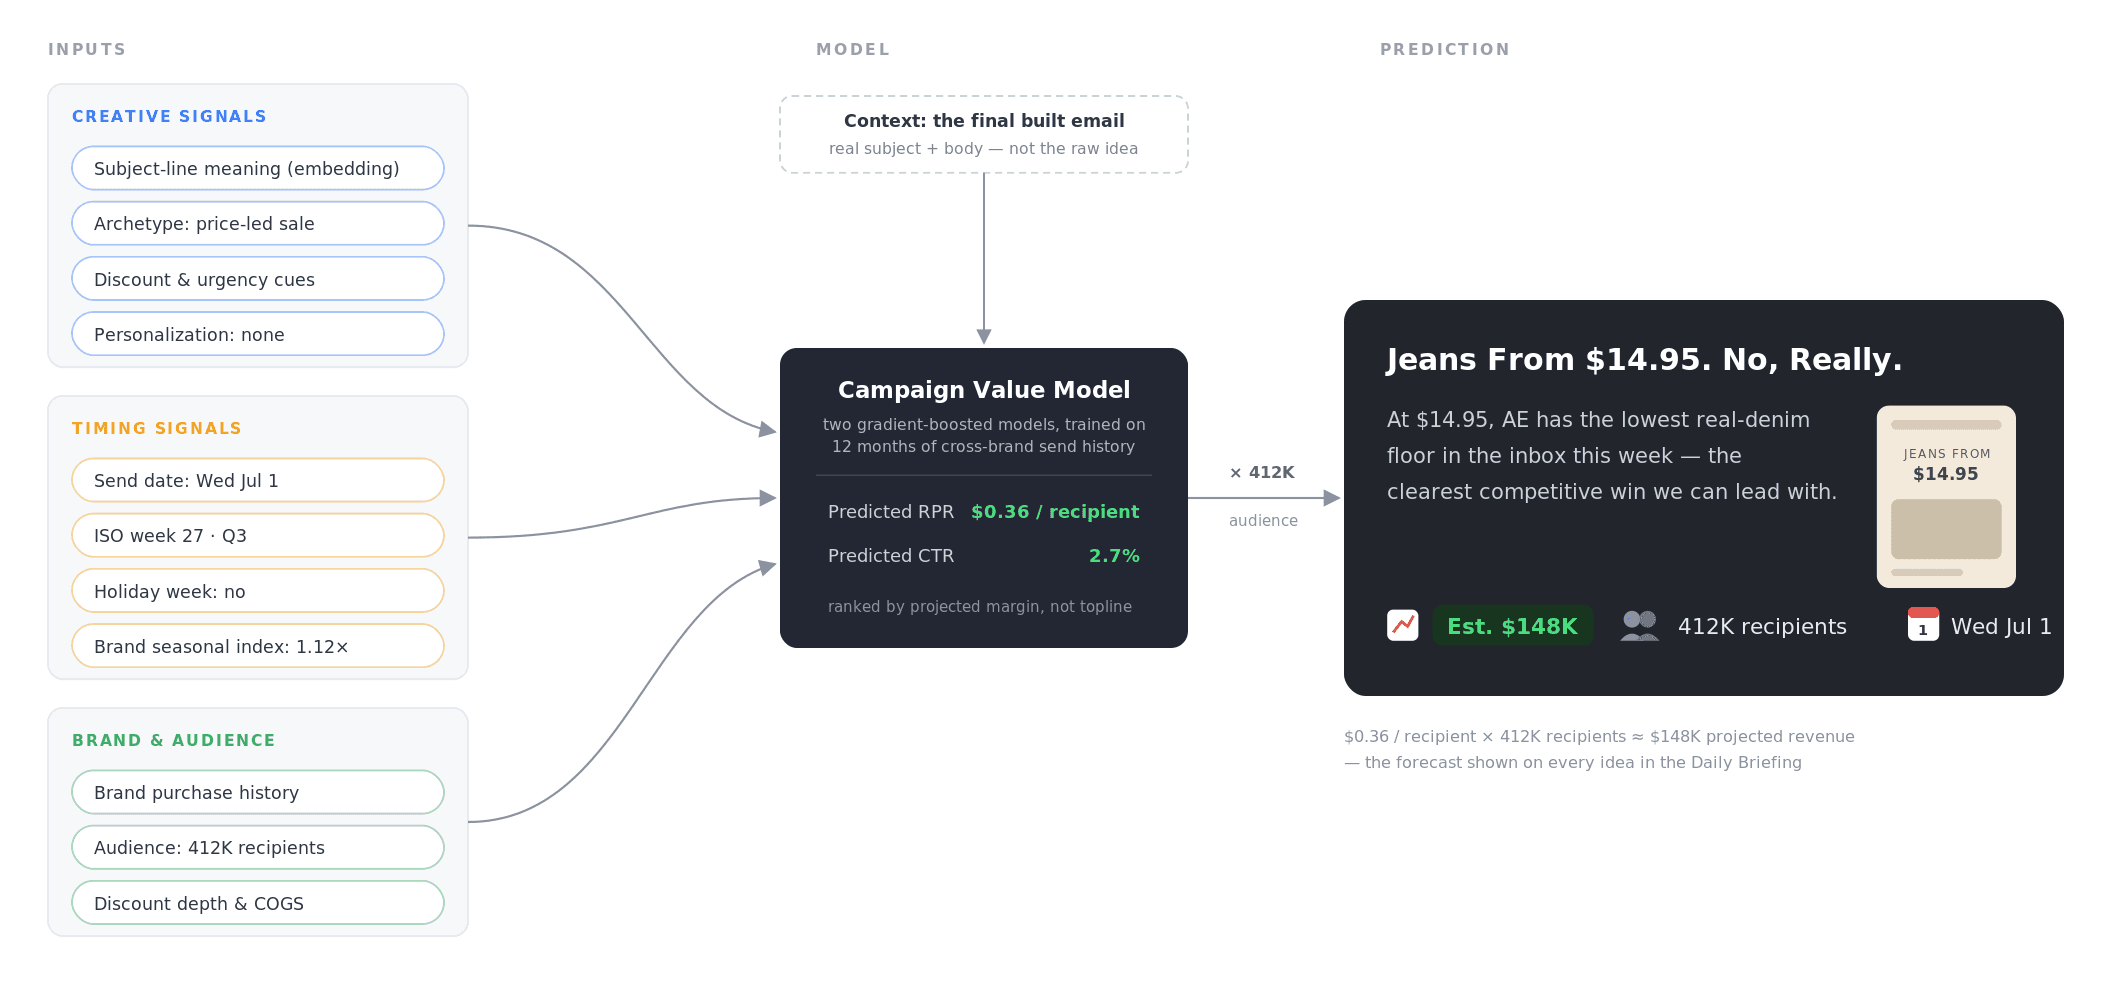
Scoring runs on the finished email, with its real subject line and body, not the raw idea, so the forecast reflects what will actually go out. Ideas in a briefing are then ranked by margin using a consistent cost assumption, so the ranking favors efficient revenue over deep-discount revenue, which is why the daily briefing can present a confident ordering instead of a flat list. The ranking is by margin per recipient, not total projected revenue, so a large low-quality audience does not automatically outrank a smaller, higher-intent one.
What the forecast actually looks at
The forecast is not a black box on top of raw history. Each idea is described to the models with a specific set of signals: a semantic read of the subject line, the campaign archetype (sale, winback, VIP, new arrivals, restock, limited-time), explicit subject signals (whether it mentions a discount, uses urgency, is personalized, and how long it is), the discount depth, the brand, and a set of calendar features (month, week of year, quarter, a holiday-week flag, and a seasonal multiplier). The models are trained on campaign-by-week cohorts using a seven-day last-touch attribution window over roughly a year of history.
The forecast is date-aware
A year of the brand's own order history teaches the models its seasonal rhythm, when its customers actually buy, rather than a generic retail calendar. From that history the system builds a per-brand weekly seasonal index.
At scoring time, the campaign's scheduled send date sets the week, quarter, holiday flag, and seasonal multiplier, so the same email gets a different forecast depending on when it is scheduled. Same email, different week, different forecast: a sale scheduled just before Black Friday and the identical sale scheduled in mid-January are not predicted to perform the same.
How it stays honest and compounds
A single brand rarely sends enough to train a stable forecast alone, so the models learn general patterns across many brands and tune to each brand through its own sales history and seasonal rhythm; a smaller brand inherits the base's patterns immediately and sharpens them as its history grows. A forecast is a prediction, not a promise. The models retrain on a rolling window of recent campaigns, so the forecast tracks each brand as it changes. The forecast decides which ideas are worth running, and the holdout separately measures whether the campaigns that did run drove incremental revenue.
Frequently asked questions
Why rank by margin instead of revenue? Because topline rewards discounting. Margin reflects what the business keeps.
Is the forecast guaranteed? No. It is validated against real outcomes and improves over time.
Isn't your training label just attributed revenue too? Yes, the label is revenue under a seven-day last-touch window, which is exactly why the ranking is by margin and why the real proof of value is holdout incrementality, not the forecast itself. The forecast is for prioritizing what to run; the holdout is for proving it worked.
Part of the machine learning behind LTV.ai.
See it on your store: book a demo.